Using Claude Code to Understand 1-Star Ratings
A practical guide to turning silent negative feedback into product insights
TL;DR: I built a workflow where Claude Code analyzes a user’s complete event history and tells me exactly why they churned—even when they leave no feedback.
Claude Code skill + export script = automated user journey analysis.
In October 2025, Lenny Rachitsky featured my use of Claude Code for social media research in his newsletter. That was fun, but the use case I’m most excited about—and use daily—is: understanding why users are frustrated, even when they won’t tell you.
I’m Director of Product at Anima, where we help product managers prototype onbrand and vibe iterate their products to product market fit.
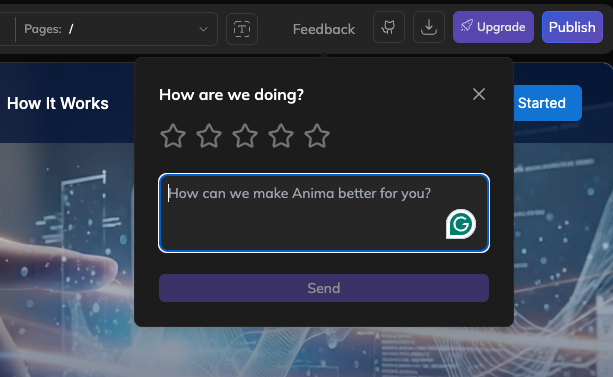
The scenario: You get a 1-star app rating with no text. Or a cancellation with “Other” selected. Or a user who was active for weeks and then vanished.
These signals come from different places: an in-app feedback widget or subscription cancellation flows.
What if you could reconstruct their entire journey and know exactly what broke?
The Output
Me: “analyze user journey for [email protected]“
Claude exports their events (using a Mixpanel API script it built), analyzes them, and returns a report that includes:
- Friction points and patterns — What broke, what they retried, what blocked them
- Timeline — Key moments from signup to churn, with timestamps
- Intent and sentiment — What they were trying to accomplish, and how their engagement changed
The output is a narrative—one person’s complete experience with your product, told through their behavioral data.
What I Do With These Reports
Product insights — When users independently hit the same friction point, that’s something we can improve.
Developer debugging — I generate a “developer friction report” with exact event sequences. Engineers can trace the user’s path through logs faster.
Customer outreach — I now have specific talking points: “I saw you spent time on X and it never worked. I’ve fixed that for you…”
My Setup
- Python script that exports user events to CSV.
- Claude Code “skill” (a markdown file with analysis instructions).
When I say “analyze user journey for [email protected],” Claude runs the workflow automatically:
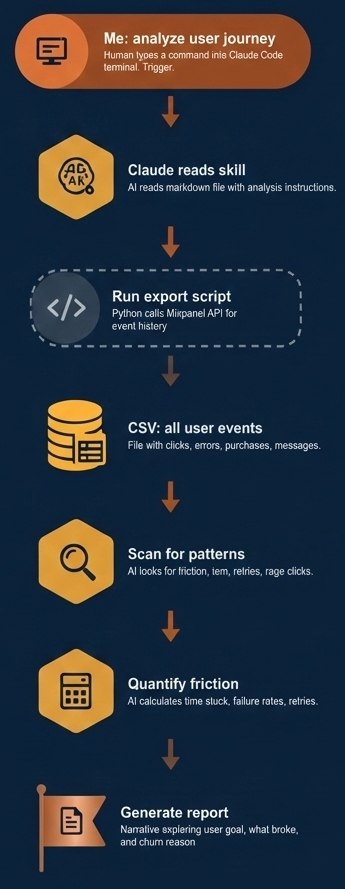
Compounding: After each analysis, I notice new patterns worth detecting. I ask Claude to update the skill. Now it automatically looks for 15+ signals I’ve added over time—repeated behavior detection, regression patterns, escalating frustration signals. Each analysis is more insightful than the last.
How You Can Do This
Step 1: Get your data out of your analytics tool
Ask Claude to write an export script for your platform (Mixpanel, Amplitude, Segment, etc.). You need: event names, timestamps, user IDs, and any relevant properties (messages, actions, payment status).
The script should take a user email and output a CSV with their complete history.
You’ll need to create an API key in your analytics platform for the export script to work.
Step 2: Ask Claude to create a skill
In a new Claude Code project (“my company analytics”), ask Claude to create a skill. Tell it:
- What events indicate friction (errors, complaints, retries)
- What events indicate success (purchases, exports, shares)
- How should friction be quantified (time spent, failure rate, resolution rate)
- What output format do you want? (executive summary, timeline, quotes, projects, etc)
Start simple. You’ll add patterns as you learn what matters.
Extending It
Visual timelines — Generate an HTML page with the journey as an interactive timeline. Share in Slack.
Developer reports — Generate a markdown file with exact event sequences so engineers can trace bugs faster.
Batch analysis — Run across a cohort (all churned users, all 1-star ratings). Find patterns that appear in 3+ journeys.
The Bigger Point
Every 1-star rating is someone who cared enough to tell you. Most frustrated users just leave quietly.
They signed up with intent. They invested time. When they leave—with or without feedback—the data still tells their story if you’re willing to read it.
Most feedback tells you “what”—user churned, user gave 1 star, user cancelled. This method reveals “why”—and “why” is where product insights live.