chart-image skill: How My OpenClaw Learned to Draw Charts - for Free
I run an OpenClaw agent on a small Fly.io machine. It monitors crypto prices, prediction markets, and developer metrics — and sends me updates on Discord and Telegram throughout the day.
The problem? It had no way to show me data visually.
The Problem
My agent runs on a 256MB Fly.io instance. When I asked it to chart a token’s price history, the options were bleak:
- Puppeteer/Playwright — Headless Chrome needs 500MB+ RAM. My machine couldn’t even install it.
- Cloud charting APIs — Per-image pricing adds up fast when your agent generates dozens of charts daily.
- Canvas libraries — Native dependencies that fail to compile on minimal containers.
- Just send numbers — A wall of text at 3am doesn’t tell you much.
I needed something that could generate a chart PNG in under a second, with zero native dependencies, on the cheapest VM money can buy.
The Solution
chart-image is an OpenClaw skill that generates publication-quality chart images using Vega-Lite and Sharp. No browser. No native compilation. Just Node.js.
My agent passes in data, gets back a PNG. That’s it.
It supports 9 chart types, dark mode, reference lines, multi-series data, sparklines, and more — everything an AI agent needs to turn raw data into visual insights.
The Gallery
Every chart below was generated by my OpenClaw agent. No screenshots, no external services — just the skill running on the same Fly.io machine that sends my morning briefs.
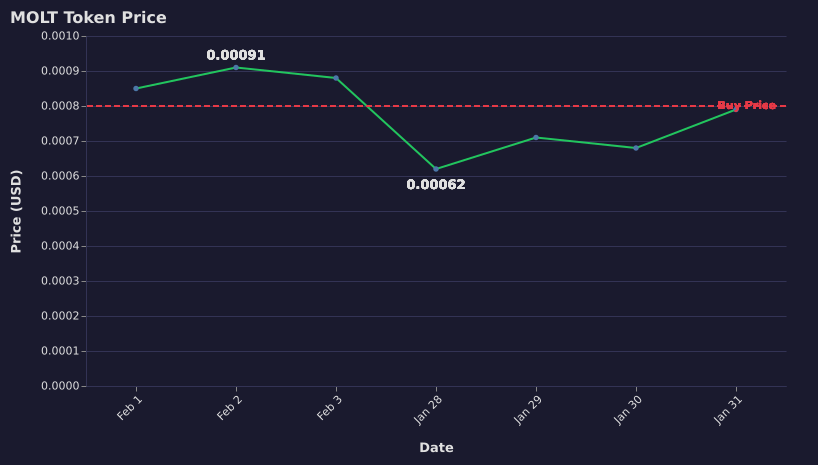
Line + Reference Line
Track prices with threshold markers
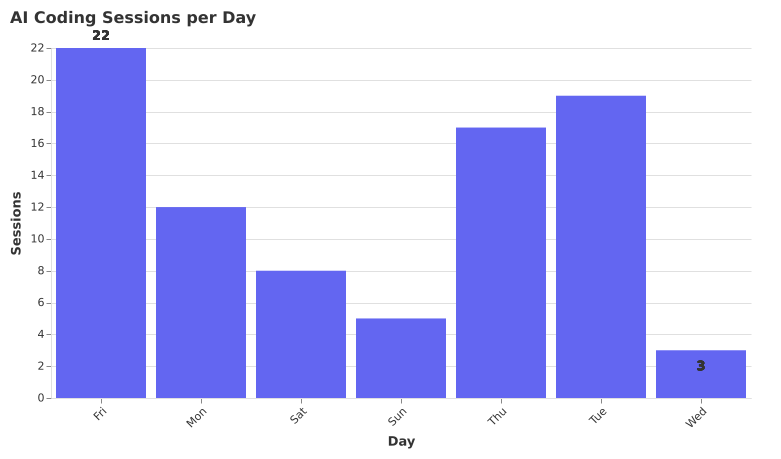
Bar Chart
Category comparisons with value labels
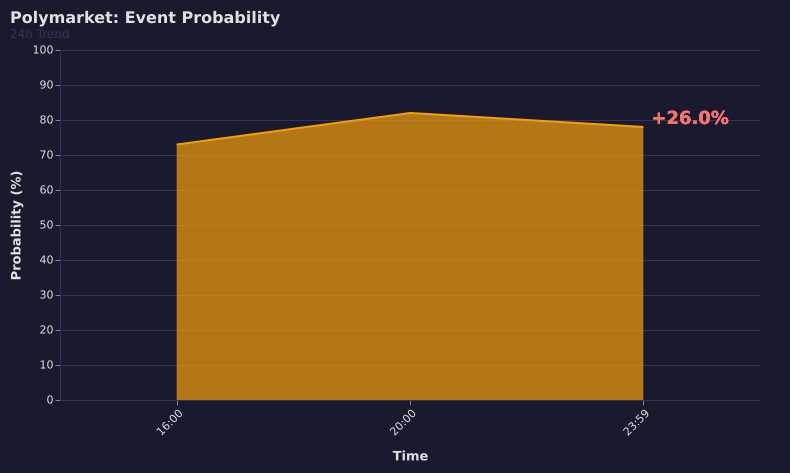
Area + Focus Mode
Zoom into recent movement for alerts
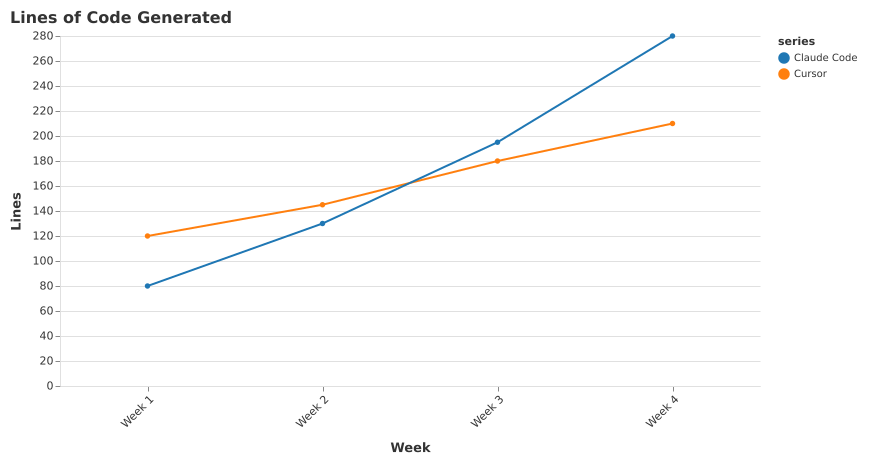
Multi-Series
Compare datasets on one chart
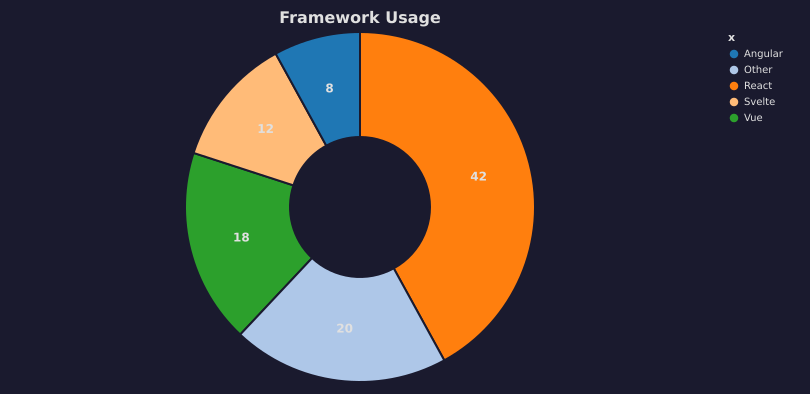
Donut Chart
Proportional breakdowns
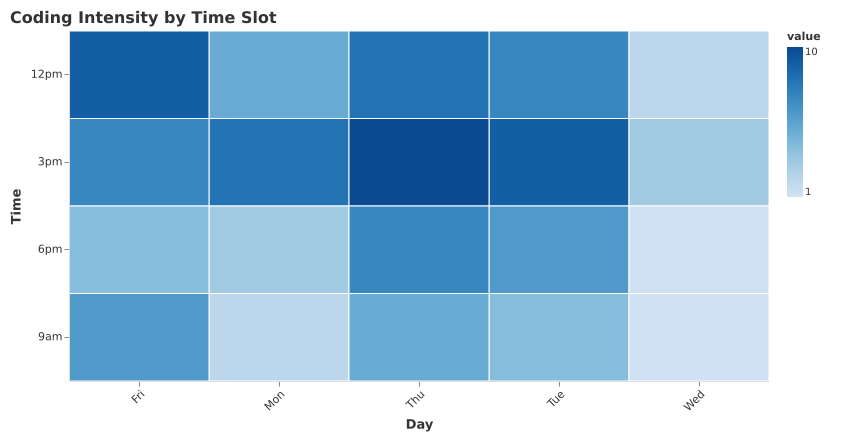
Heatmap
Two-dimensional patterns
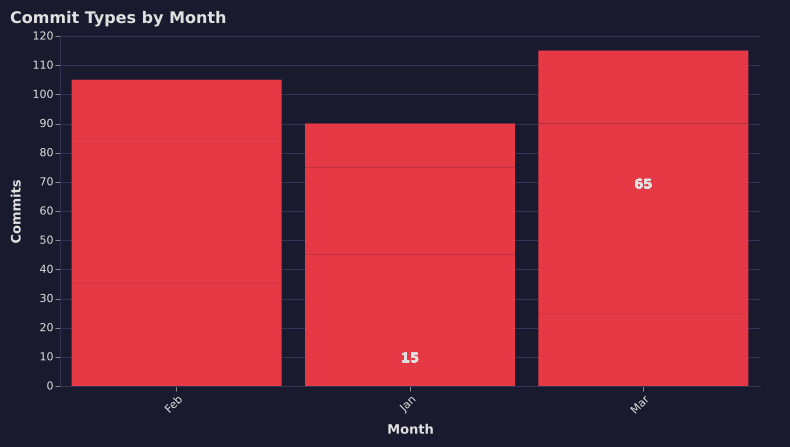
Stacked Bar
Composition within categories
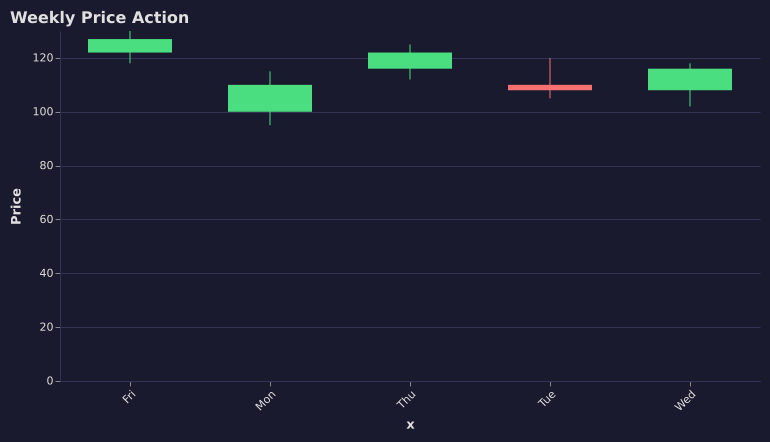
Candlestick
Financial OHLC data

Sparkline
Tiny inline trend indicators
How My Agent Actually Uses This
The charts above aren’t hypothetical examples — these are the workflows running on my OpenClaw instance right now. The real power is how chart-image combines with other OpenClaw skills:
🪙 Crypto Price Alerts
The agent uses the polymarket skill to fetch prediction market data, then pipes it straight into chart-image to generate a line chart with my buy price marked. If something’s moving, it uses the search-x skill to pull context from X/Twitter. Three skills, one alert — delivered to Discord automatically.
📊 Prediction Market Monitor
The polymarket skill polls every 30 minutes. When probability shifts more than 3%, chart-image generates an area chart with --focus-recent to highlight the move. The agent combines both outputs into a single visual update.
☀️ Morning Brief
Each morning at 7:30am, the agent chains the weather skill, calendar skill, and chart-image together — I get a visual summary on Telegram that’s scannable in seconds instead of walls of text.
👨💻 Developer Metrics
Git activity gets visualized as stacked bars (commit types) and heatmaps (coding hours). The agent posts these to our team Discord channel.
This is what skill composition looks like in OpenClaw — each skill does one thing well, and the agent orchestrates them together. No human involved.
Why OpenClaw + Skills
This is what the OpenClaw skill system is built for. Skills are modular capabilities that agents can install and use autonomously:
- Install by asking: Just tell your agent “Hey, install chart-image from ClawHub” — it handles the rest. No CLI commands, no manual setup
- Zero config: No API keys, no cloud accounts. It runs locally on your machine
- Composable: Chain it with other skills — fetch Polymarket data, generate a chart, search X for context, send to Discord. All in one agent turn
- Lightweight: Works on Fly.io free tier, Raspberry Pi, any Node.js environment
The skill is published on ClawHub — the skill registry for OpenClaw agents. Tell your agent to install what it needs, and it’s immediately more capable.
Technical Specs
| Runtime | Node.js — no native compilation, no Puppeteer |
| Rendering | Vega-Lite → SVG → Sharp → PNG |
| Speed | ~200ms per chart |
| Memory | ~50MB peak (vs 500MB+ for headless Chrome) |
| Chart types | Line, bar, area, pie/donut, heatmap, candlestick, stacked, multi-series, sparkline |
| Features | Dark mode, reference lines, value labels, focus zoom, subtitles, annotations |
| Output | PNG or SVG |
Get It
Just ask your OpenClaw agent:
“Hey, install chart-image from ClawHub”
That’s it. Your agent finds it on ClawHub, installs it, and starts using it. No manual downloads, no configuration files. Published under @dannyshmueli — open source and free.
This skill was built by my agent, improved nightly by that same agent, and used by it every single day. The charts in this post were generated by the skill itself, for this post. Dogfooding all the way down. 🐱🦞